guilhermesportfolio
Waffle Plot (EN-AU)
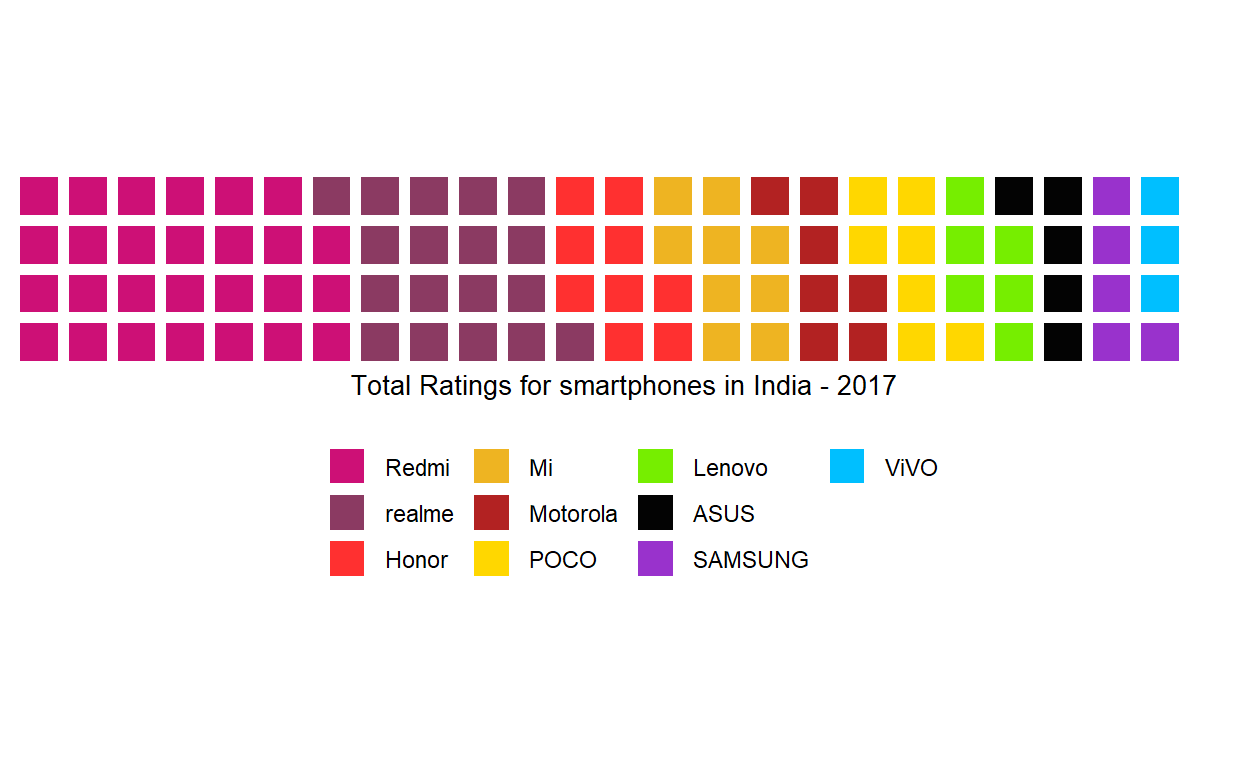
Returning to the previous analysis about smartphones in India, we will se who was the most important player from that time using waffle plots.
Waffle Plot (PT-BR)
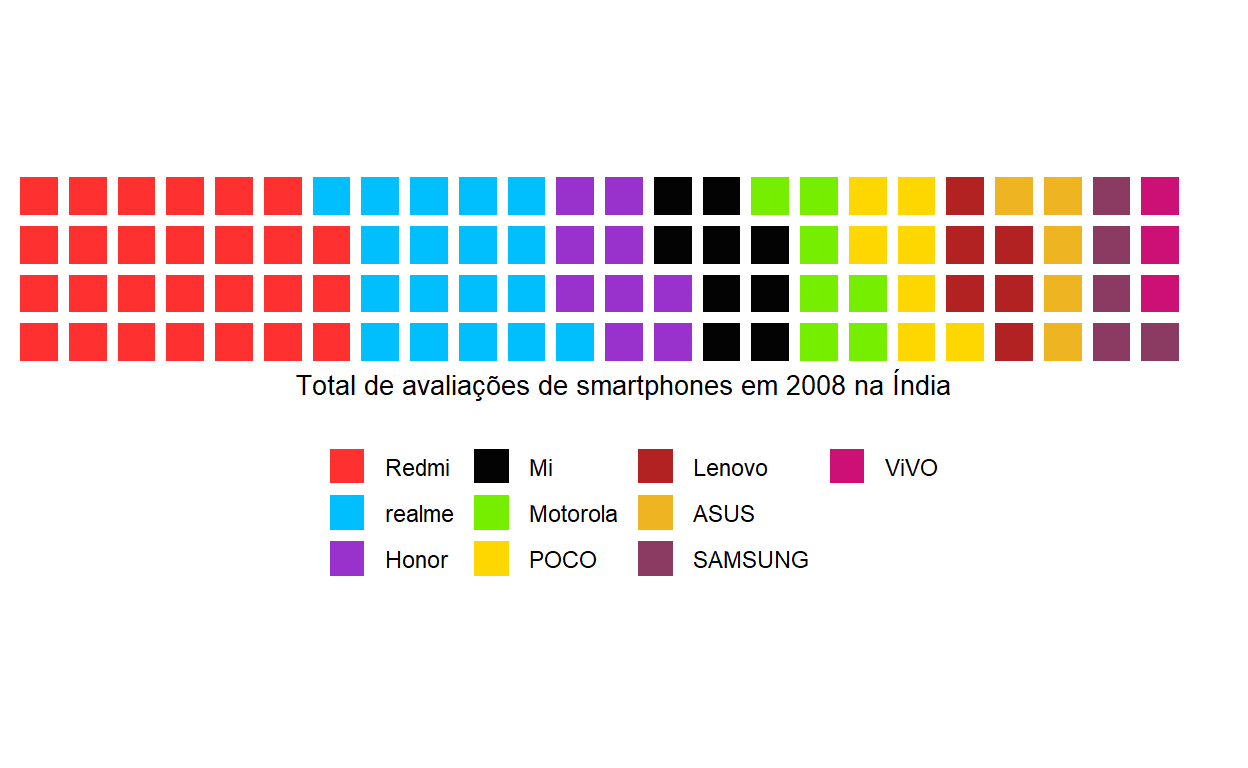
Retomando a análise prévia sobre os dados de smartphones na Índia. Neste post continuarei explorando os dados em busca de perguntas e respostas que podem nos levar a resultados interessantes.
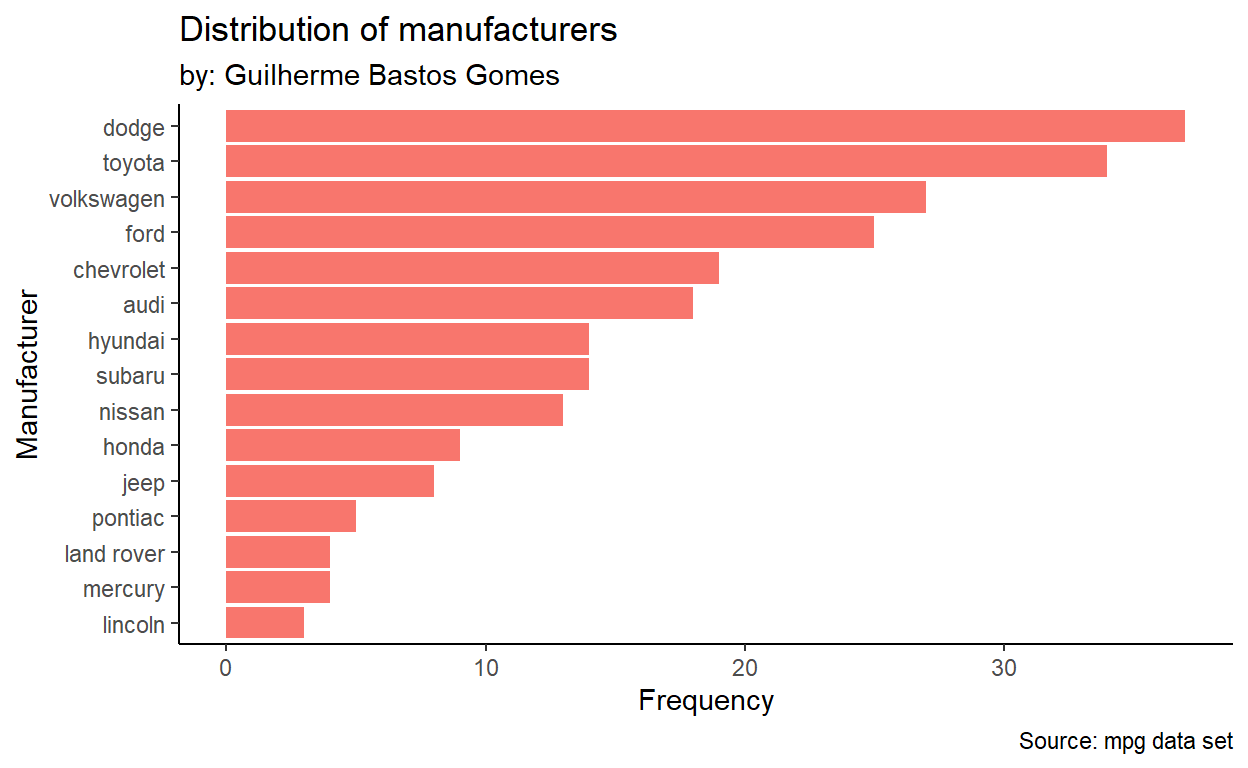
Lollipop charts and the Janitor Package
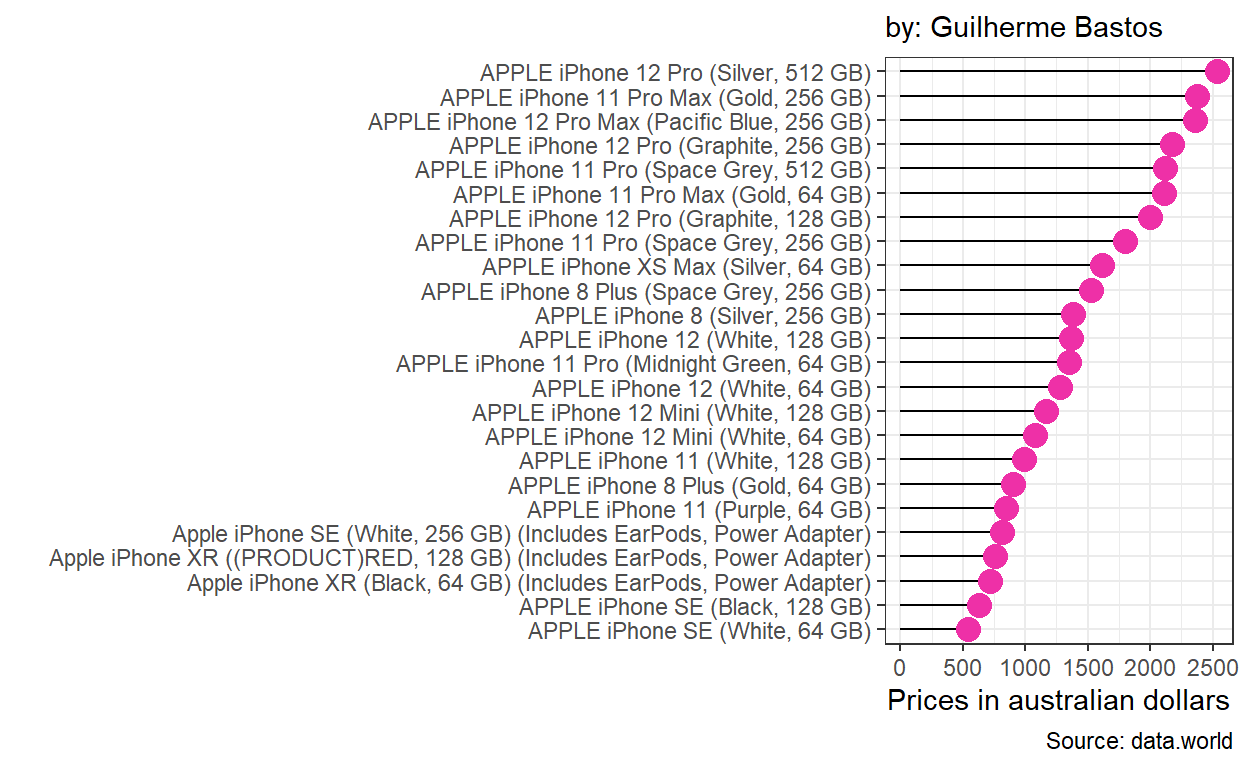
In the data.world platform I have found a data set with data from smartphones in India where it's possible to find several models, their prices and ratings. In this post, I will use the tools and skills have developed so far to explore and analise these data.
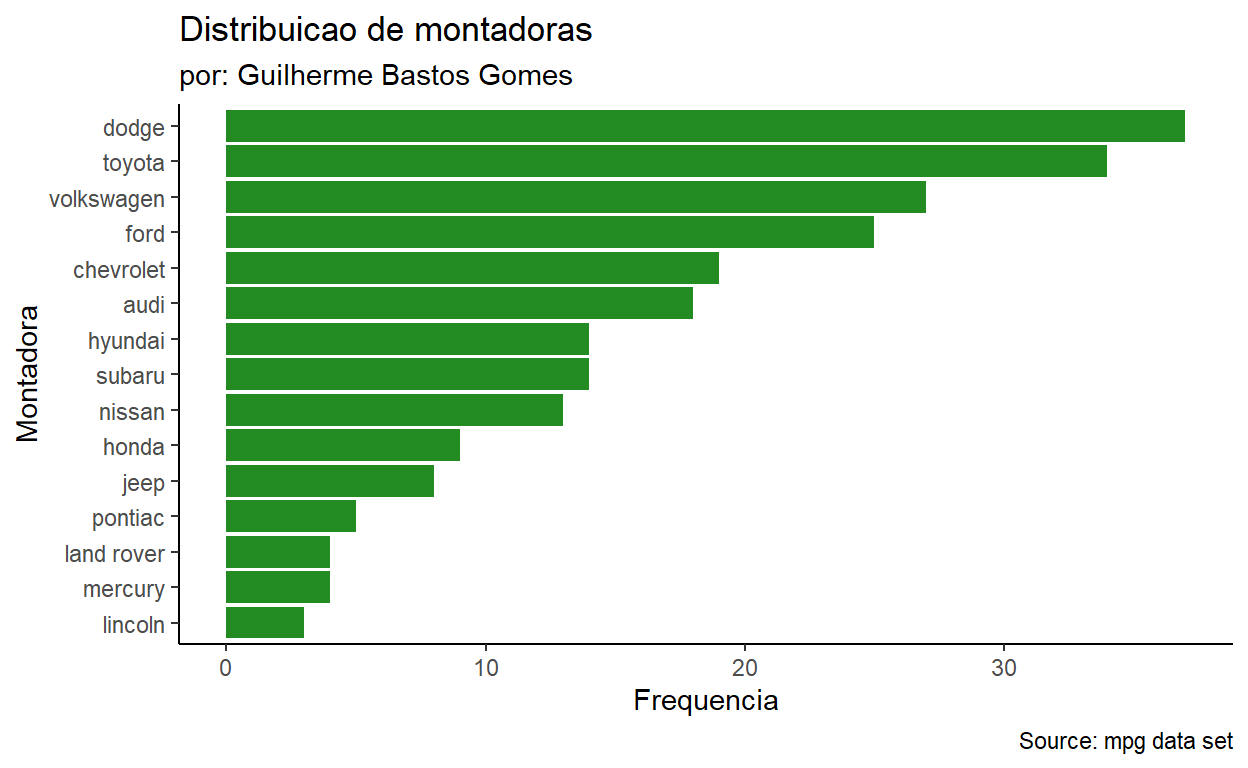
Gráficos de pirulito e o pacote Janitor
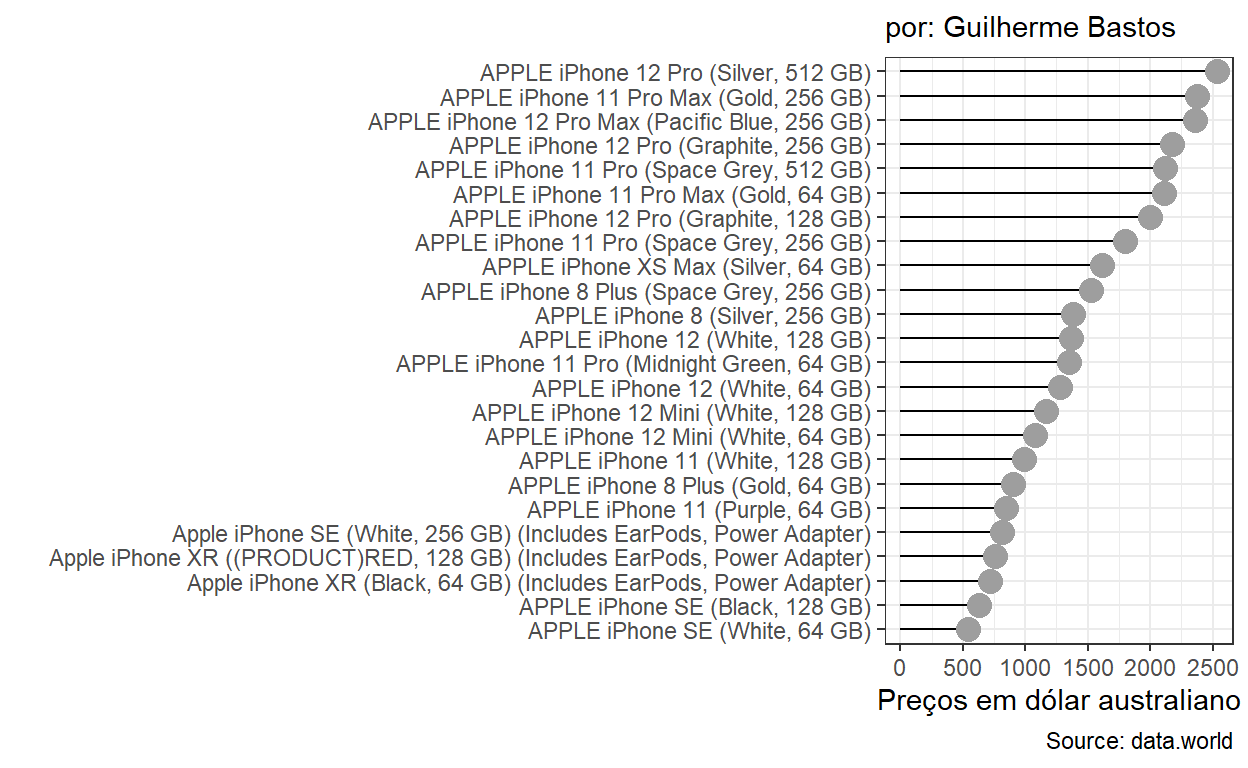
Navegando na plataforma data.world encontrei um conjunto de dados sobre smartphones na Índia. Nesse data set é possível encontrar diversos modelos, seus preços e o número de avaliações que cada um recebeu. Nesse post, uso as ferramentas que desenvolvemos até o momento para explorar e análisar esses dados.

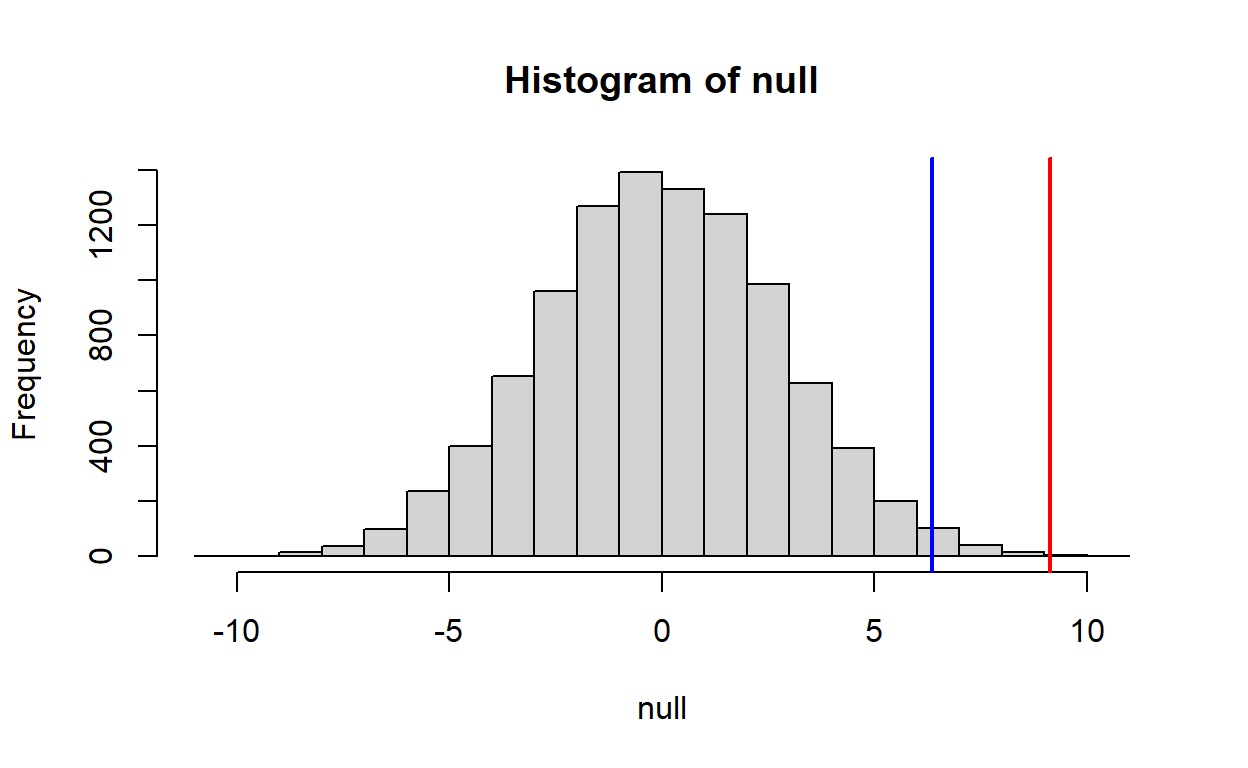
Hypothesis test and P-value
In this post I am going to show you how to test your hypothesis by using the null hypothesis in R, that is how scientists can act like skeptics when analising data.
Teste de hipótese e p-valor
Neste post iremos testar hipóteses a partir da observação de diferenças e no impacto de uma variável categórica.

Correlação com R
Neste post escrevo sobre correlação entre duas variáveis, como encontrar e interpretar esse conceito.
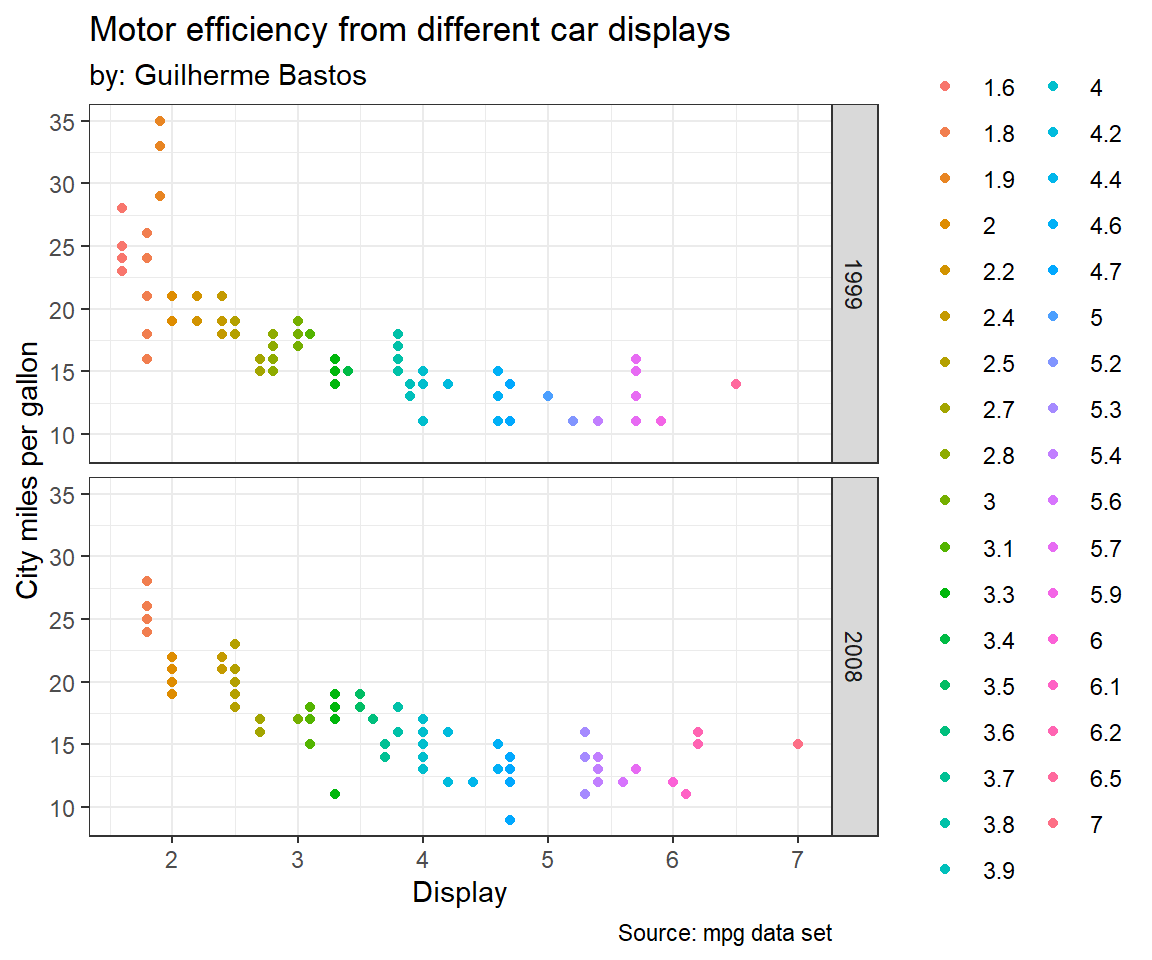
Correlation in R
In this post I am writing about the correlation between two variables, how to find and interpret this concept.
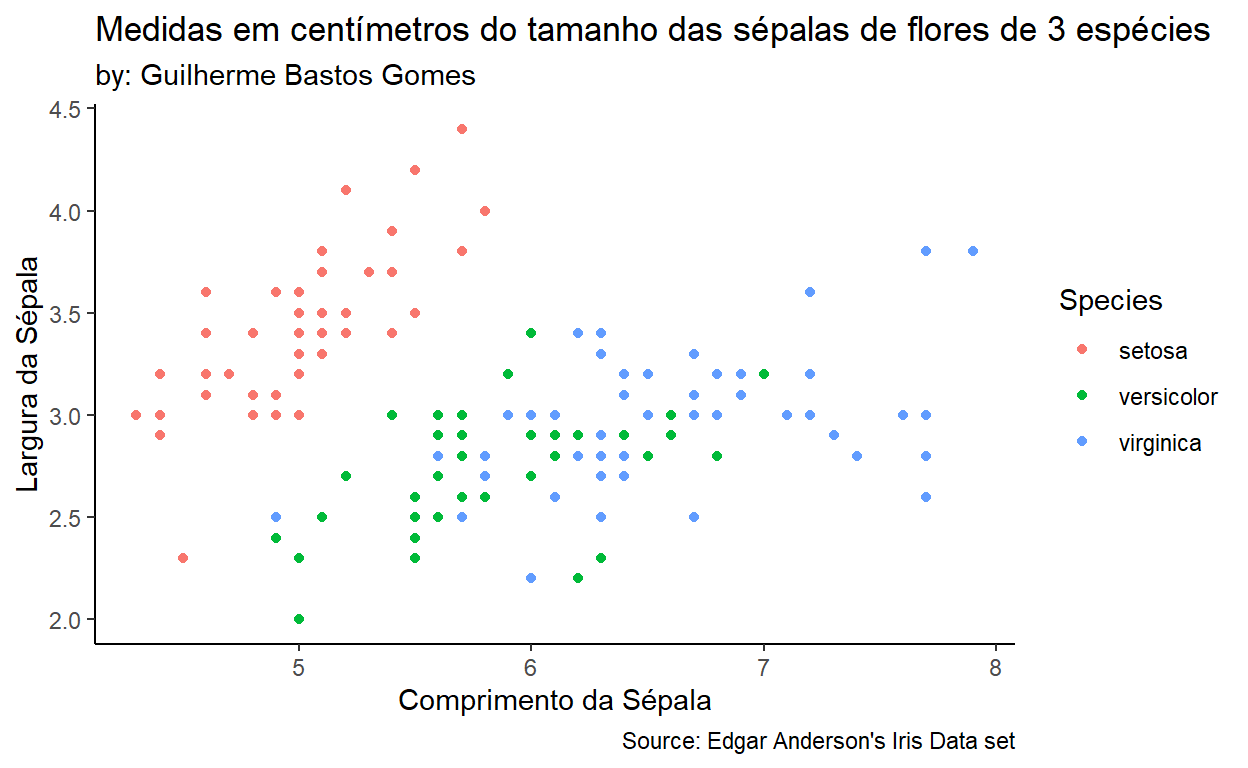
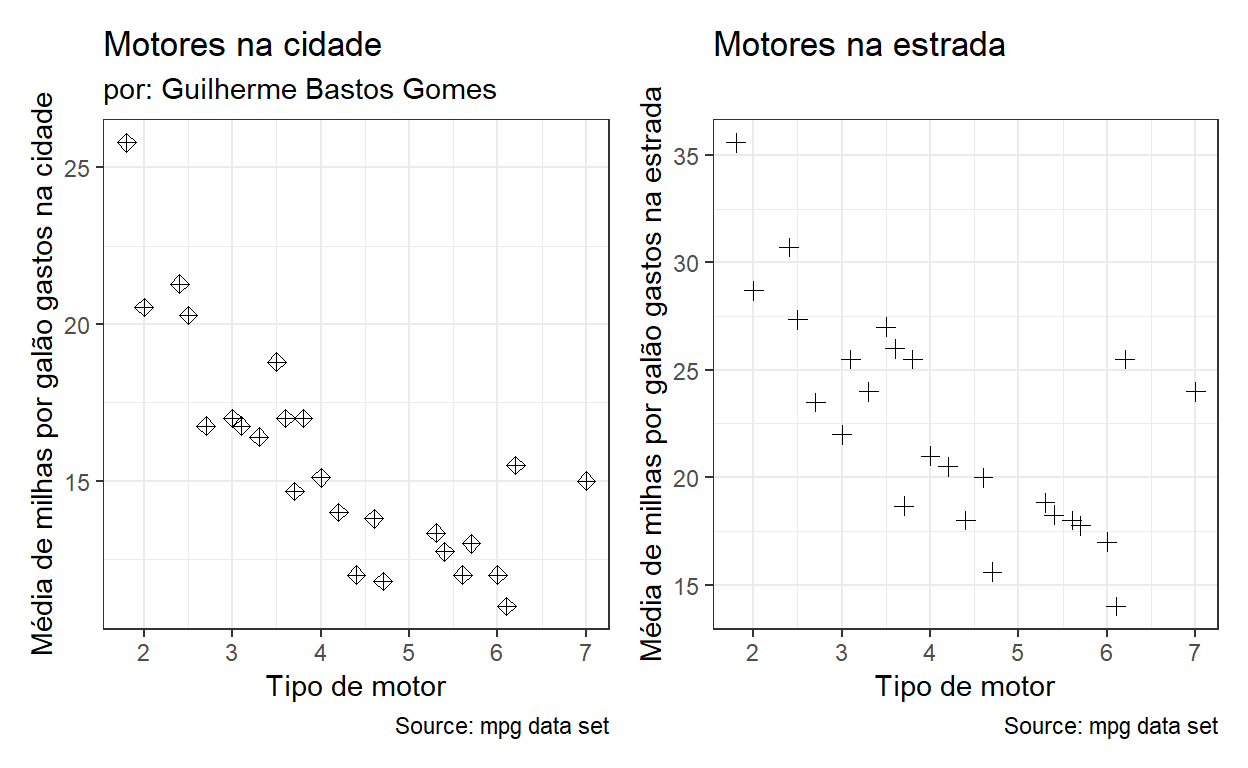
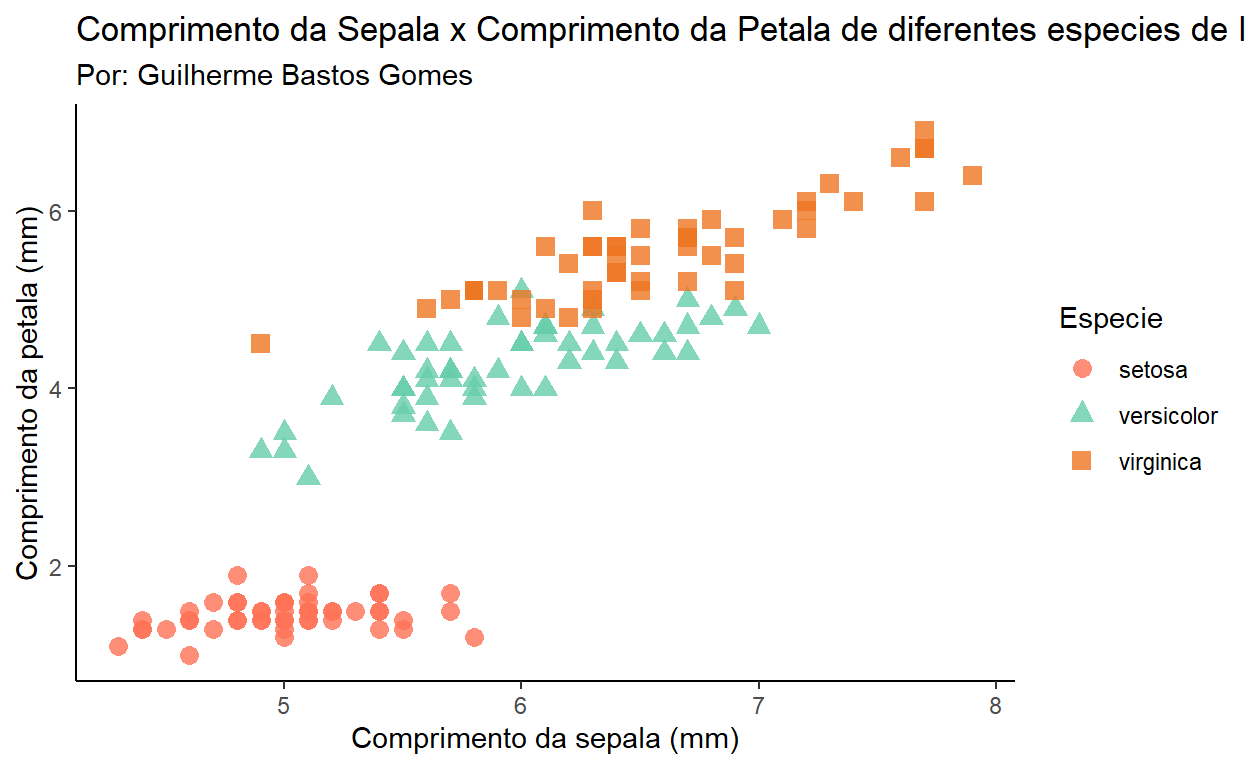
Covariação e Scatter Plot
Neste post pretendo discutir o conceito de covariação e mostrar como fazer um scatter plot para visualizar a relação entre duas variáveis.
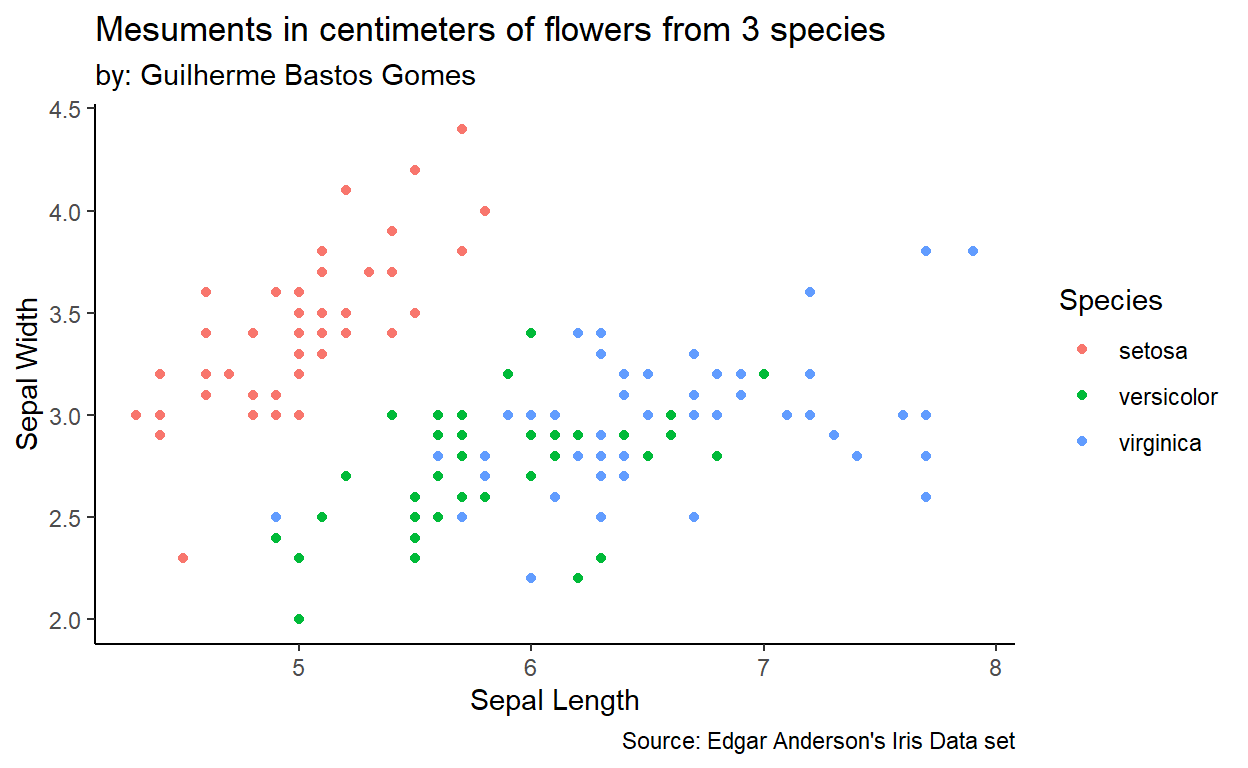
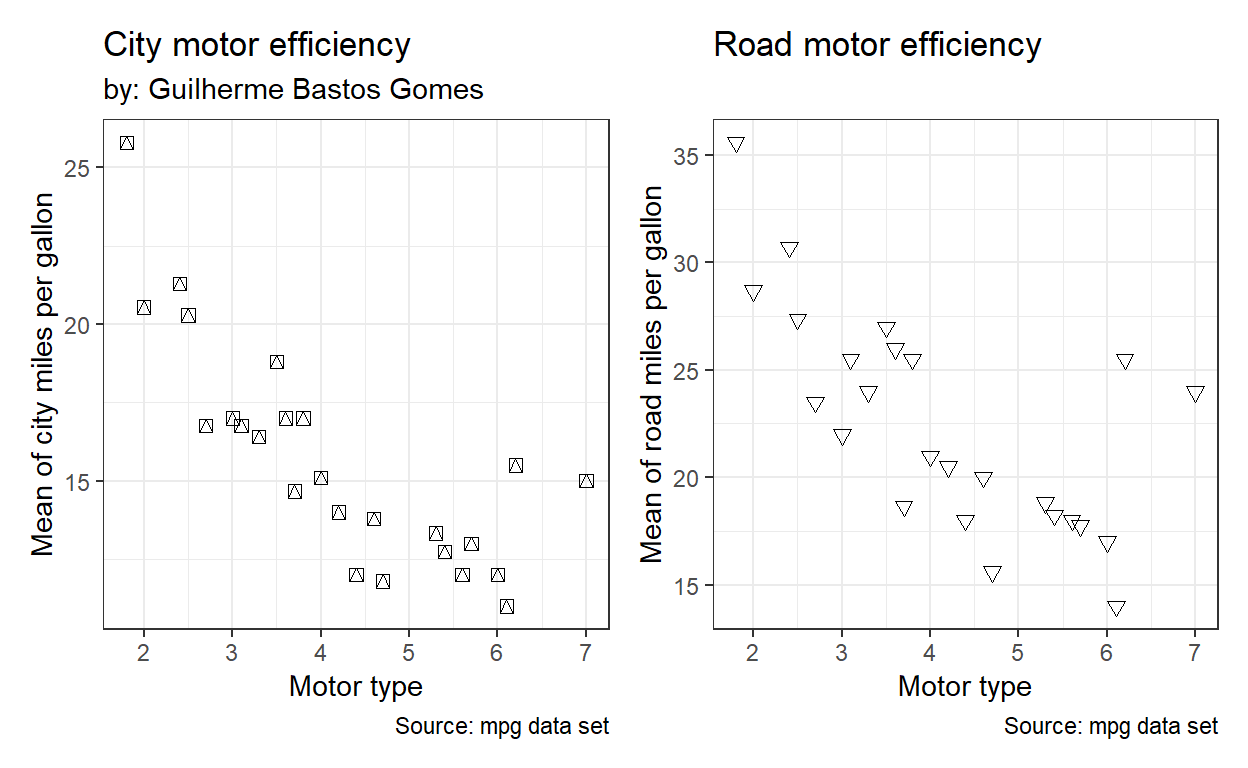
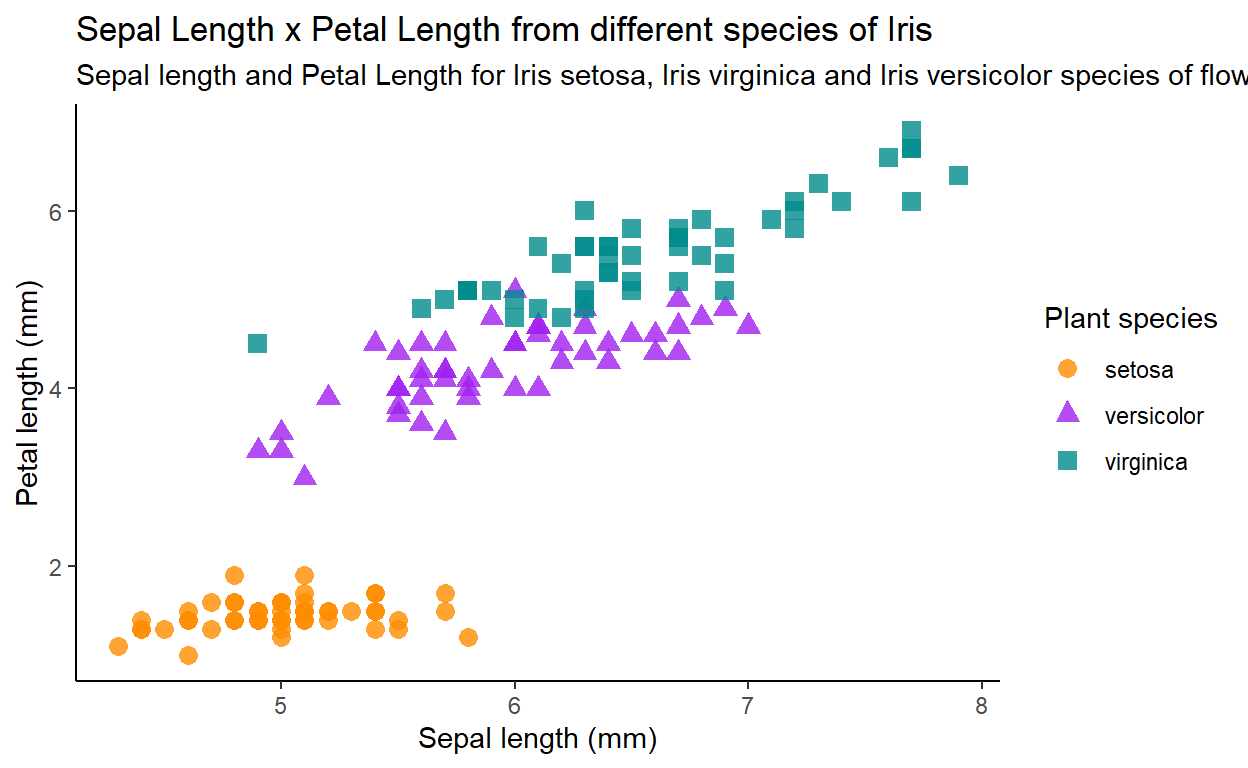
Covariation and Scatter Plots
In this post I intend to use the concept of covariation and show you how to do a scatter plot in R.

Learning how to build Boxplots and ViolinPlots using R (EN-AU)
In this post I am showing how to analyse Boxplots and Violin Plots using the ggplot2 package in the R programming language.
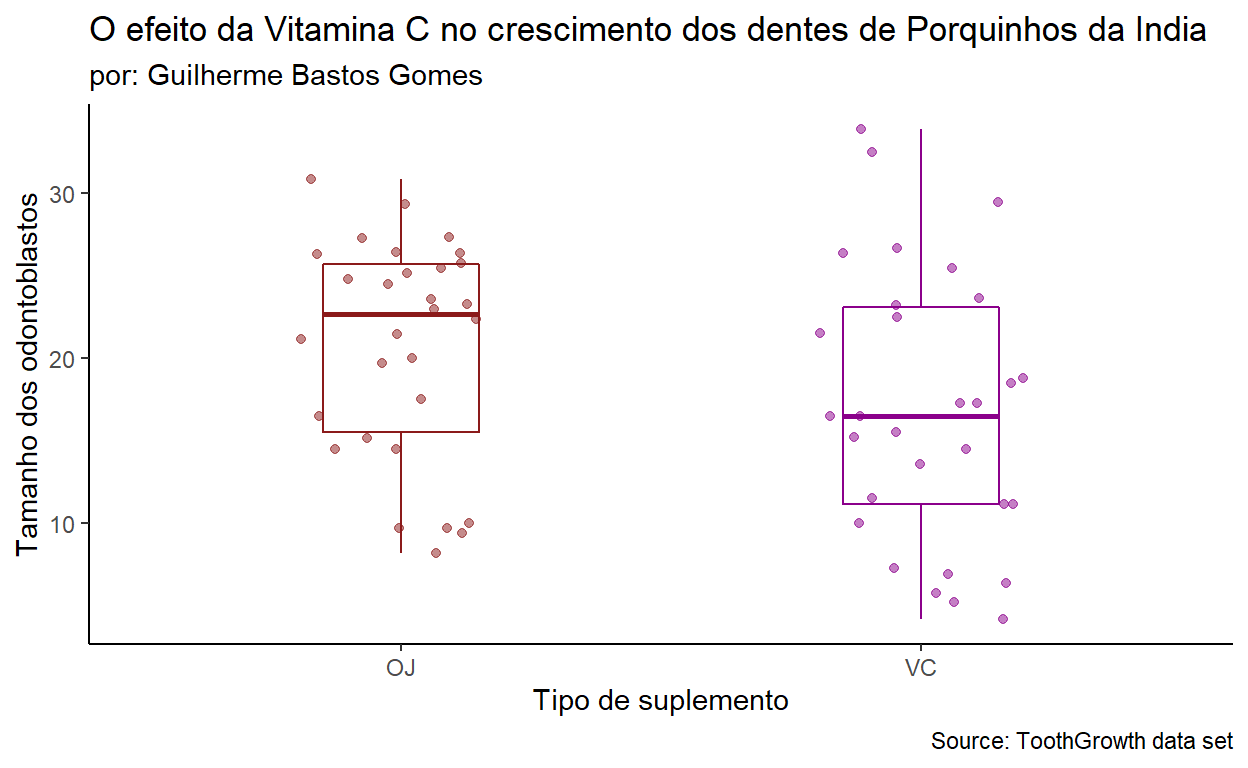
Análise exploratória dos dados: Boxplots e ViolinPlots
Neste post vou descrever e mostrar como fazer Boxplots ou gráficos de caixa usando o pacote tidyverse da linguagem de programação R, também falo sobre ViolinPlots.
Exploratory Data Analysis tools using R
In this post I'm showing the main tools that we use to analyse data in R with the tidyverse package. Also a little about variation, categorical and continuous variables.
Ferramentas de exploração de dados em R
Neste post mostro quais as principais ferramentas que usamos ao analisar dados, usando a linguagem R e o tidyverse. Também falo sobre variação e como analisar variáveis categóricas e continuas.
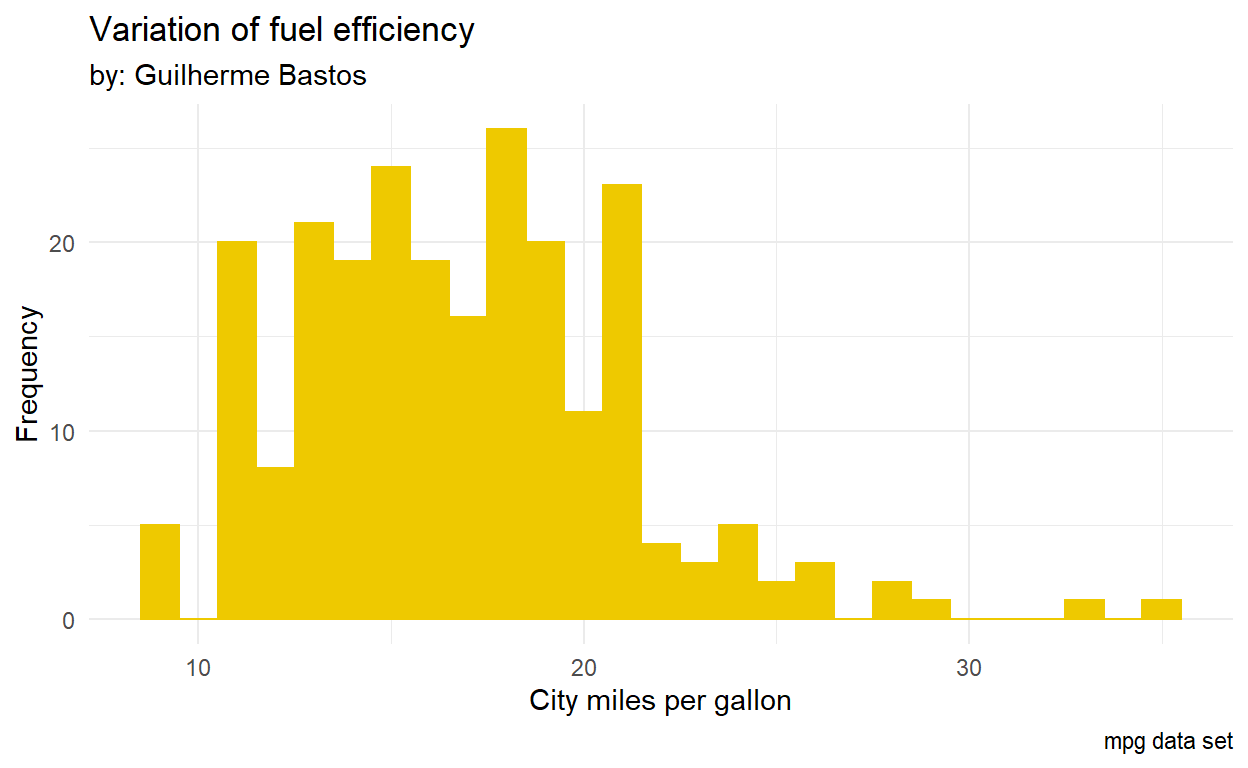
Plotting with ggplot2
In this post we will use histograms to find groups in our data.
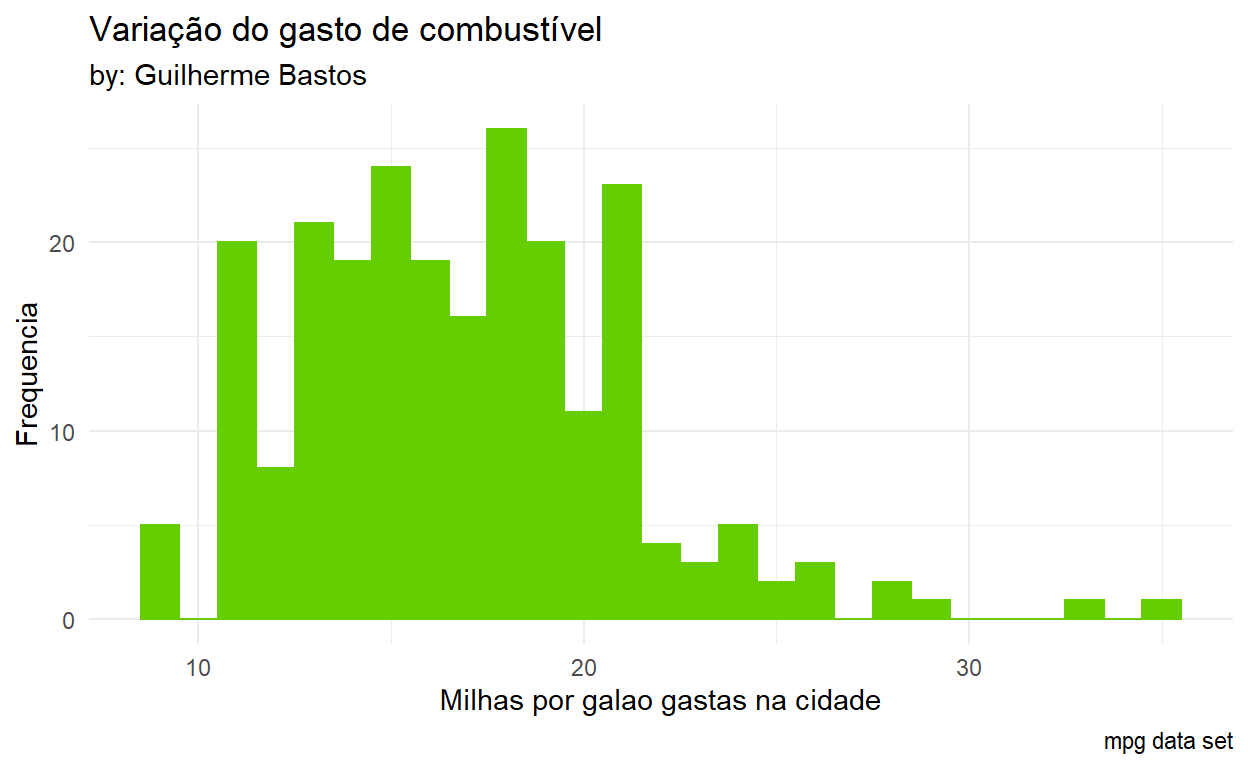
Histogramas com ggplot2
Neste post usaremos histogramas para compreender grupos nos dados.
Using tidyverse functions
In this post I combine some of the tidyverse functions to obtain interesting stats from the data. The main idea is to work with the tools we've already used. In the case of a new tool showing up, I will explain it, but always remeber that you can read about R functions by tiping "?nameofthefunction" in the console!
Combinando as ferramentas do tidyverse
Neste post combino as funções do tidyverse para obter estatísticas interessantes sobre os dados. A ideia principal é trabalhar com as ferramentas já explicadas em outros posts. Caso uma ferramenta nova apareça, explicarei, mas lembre que é possível ler sobre as funções do R digitando "?nomedafunção" no console!
About the structure of variables
Variables are everywhere, let's understand a bit more about their structures in the R programming language.
Sobre a estrutura das variáveis
Variáveis estão em todos os lugares, vamos entender um pouco mais sobre suas estruturas em R.
Grouping and counting in the tidyverse
In this post, I will show you how to group and count your data to generate some stats. During an analysis it's pretty common to spend some time with EDA.

Agrupar e contar dados com tidyverse
Neste post, vou mostrar como agrupar e contar seus dados para gerar algumas estatísticas. Durante uma análise de dados é bem comum passar um tempo com EDA.
O poder do tidyverse: manipulação de dados (PT-BR)
Vou traduzir meus posts aqui para ocasionalmente ajudar outros falantes de português a entenderem e usarem R para manipular dados. O Tidyverse é um pacote bastante importante para manipulação de dados, é extremamente fácil de usar e aprender.
The power of the tidyverse: manipulating data (EN)
In this post I am showing you how to use the basic tools from the R package tidyverse to analyse data. These tools are useful to deal with a whole sort of data!
Testing!
This is my first post, it is a test so there's nothing in it besides text and stuff. You know what, I am going to write something... Nah, changed my mind, let's just keep this a test, sorry.
Welcome to My Portfolio!
This is where I am going to post everything I did using R and other programming languages!